 |
||||||||||||||||
|
||||||||||||||||
| China Investment Report - Quality Chinese Stock Picks |
| China Business Report - Weekly China Business News Summary |
 ASIA RESEARCH |
|
China Hong Kong Taiwan Japan South Korea India Indonesia Malaysia Philippines Singapore Thailand Pakistan Vietnam Mauritius Others |
| AMERICAS |
|
United States
Canada Mexico Brazil Chile Peru Argentina Others |
| EUROPE |
|
Britain
Germany France Spain Austria Belgium Norway Russia Czech Republic Denmark Finland Hungary Ireland Italy Netherlands Portugal Sweden Switzerland Turkey Greece Others |
| MIDDLE EAST / AFRICA |
| Tanzania Israel South Africa Zimbabwe Others |
| ADVERTISEMENTS |
|
Managed Futures
Performance Forex Broker Buy Foreign Currency |
Technical Analysis
Point and Figure Charts
A prominent method of stock technical analysis in the 1960’s that has not
been as widely-followed since, Point & Figure technical analysis actually
dates its roots all the way back to the late 1800’s and Charles Dow, founder
of the Dow Jones Company. Around the turn of the 20th Century, many savvy
investors started to realize that certain stock patterns repeated
themselves; as a result, point and figure analysis evolved as a simple,
logical way to record share price movements.
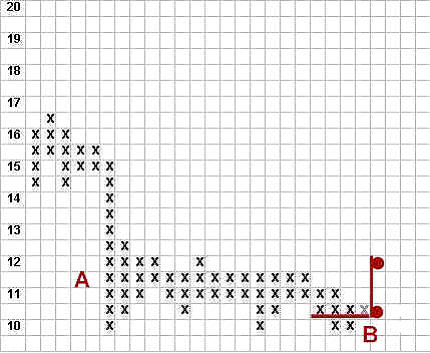
As can be seen in the sample point and figure chart below, columns marked by
an “X” indicate periods when the stock was rising, columns including “O”
show when the stock was falling:
Sample Point and Figure Chart
Unlike other forms of stock charting, this style typically uses the “3-box
reversal” method, requiring a rally or pullback of 3 points (or boxes)
before moving the chart from one column to another. What investors are left
with are charts that tend to filter out the noise of small price
fluctuations and a picture in which clear patterns emerge and trend lines
can easily be drawn.
In fact, this is precisely the purpose of point & figure analysis—to produce charts that are logical, clear and simple to read. Consider the way a leading expert describes P & F’s rationale:
“The premise of Point & Figure charting is to provide a logical, organized and sensible way of recording the supply and demand relationship in any particular security or sector. When it is all said and done, if there are more buyers in a particular security than there are sellers willing to sell, the price will rise. On the other hand, if there are more sellers in a particular security than there are buyers willing to buy, then the price will decline. If buying and selling are equal, the price will remain the same. This is the irrefutable law of supply and demand. The same reasons that cause price fluctuations in produce such as potatoes, corn and asparagus cause price fluctuations in securities.” - from the book "Point and Figure Charting," by Tom Dorsey.
Tom Dorsey, it should be noted, is one of the founders of Dorsey Wright & Associates, a firm primarily dedicated to serving investment professionals and today’s leader in the point and figure methodology.
To review, the following are the key features of Point & Figure equity
analysis:
· P&F charts have been around for over 100 years, first advocated by Charles
Dow of Dow Jones fame.
· P&F charts are key to successful to stock market trading. You can look at
short, intermediate and long-term views.
· Formations, patterns and signals are easy to recognize and interpret, and
tend to repeat themselves.
· You can chart stocks by hand or get updates from many websites.
· Trends are readily identified from trend lines.
· Price objectives can easily be established.
· It should enable investors to clearly see support and resistance points.
· The method is up to the minute.
· P&F charts can be used successfully with stocks, bonds, commodities, and
other investment vehicles.
· Used properly, time factors, the confusing volume indications, and
irrelevant minor fluctuations are minimized.
Fundamentals can help answer the question of WHAT to buy and
technicals answer the question of WHEN to buy.
|
Contact Us |
Copyright & Trademarks |
Privacy Policy |
Disclaimer |
Use of Hyperlinks |
Site Map |